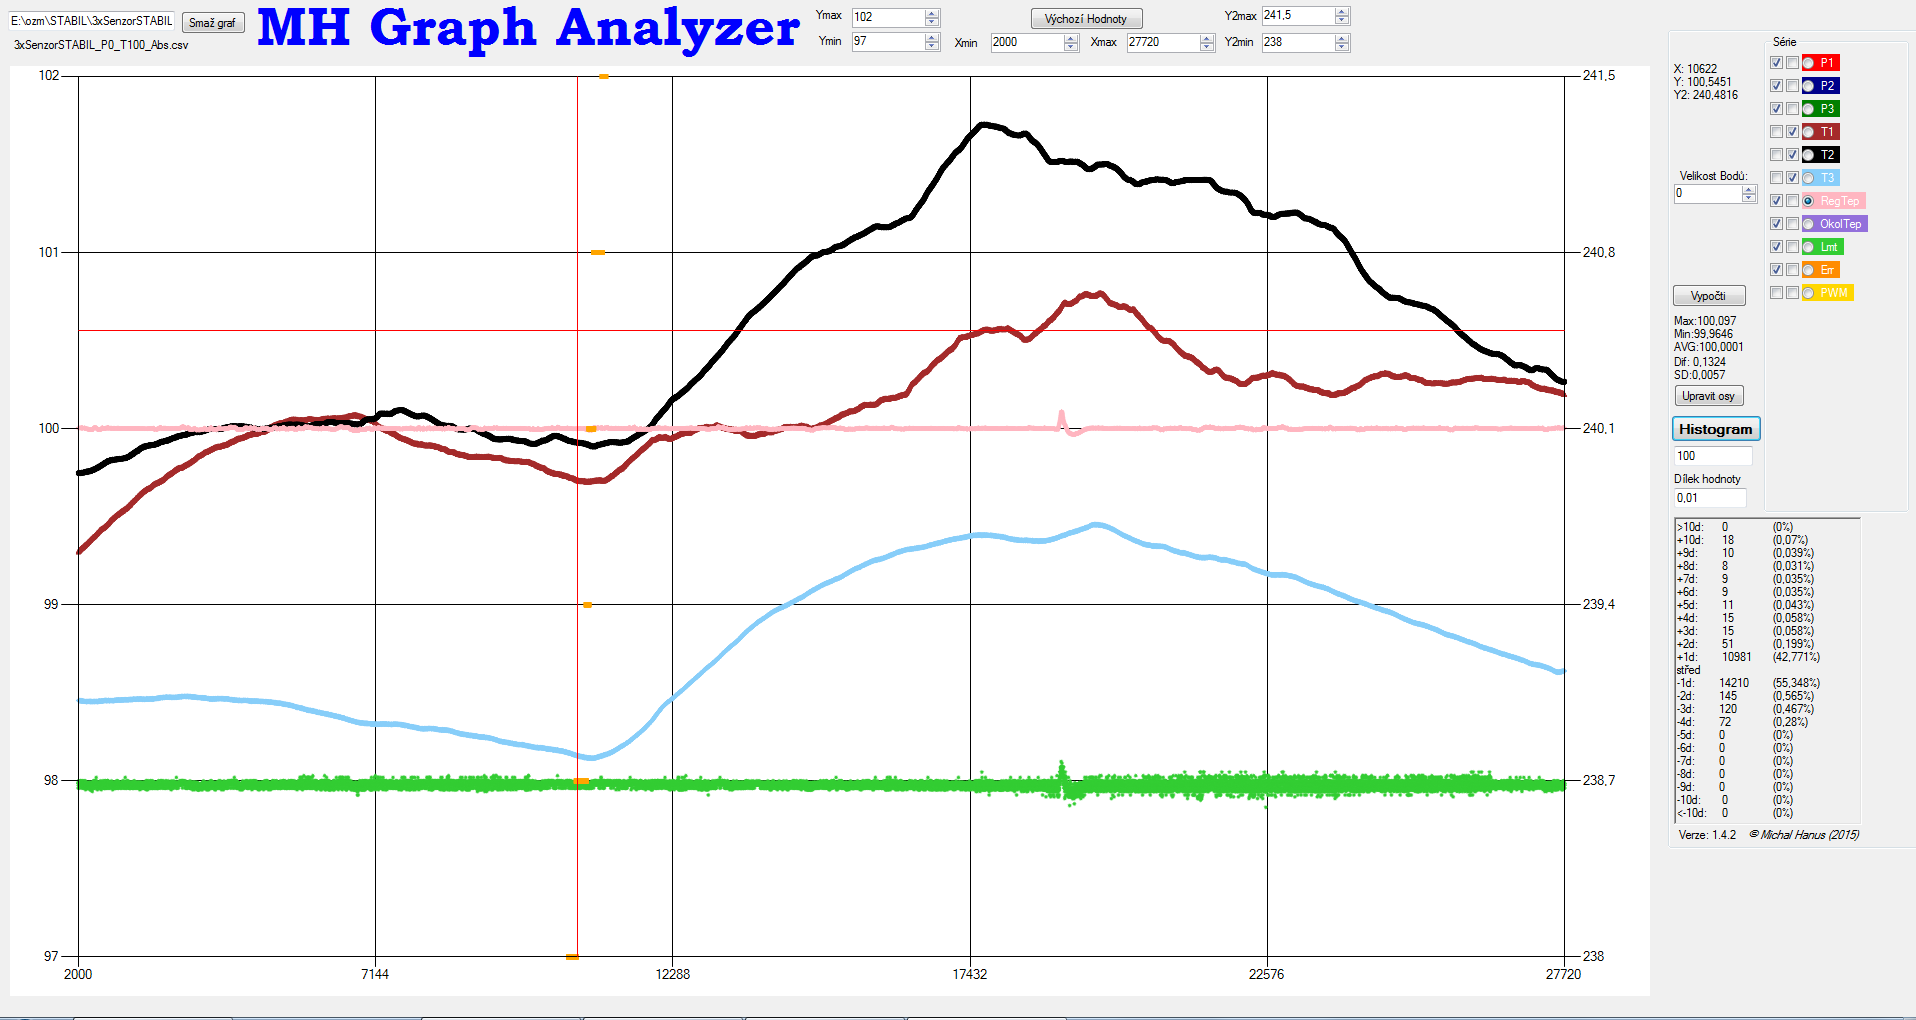
MH Graph
Analyzer
A program written in C#
language in Visual Studio 2012. It can upload, show and analyze up to 20 series
and 100,000 lines of data in CSV format (“;” separated) with a single X-axis
and two independent Y-axes.
It allows to:
- zoom the graph with a mouse
or by entering values to the textboxes of the axes, with a possible return to
the default values;
- assign series to the primary
or the secondary Y-axis or hide the series;
- choose data points size;
- read the values from graph by
moving the cursor
- automatically zoom the graph
according to the max/min values of the selected series;
- calculate maximum, minimum
and average value of a selected series, max/min difference and standard
deviation of the values in the zoomed window;
- calculate the histogram of
the selected series in the zoomed window.
First version made in March 2015.